
Kia Sportage QL vs Nissan Qashqai J11: specs side by side
Quick comparison from catalog data - no editorial review of this pair yet.

Kia · 2015–2021
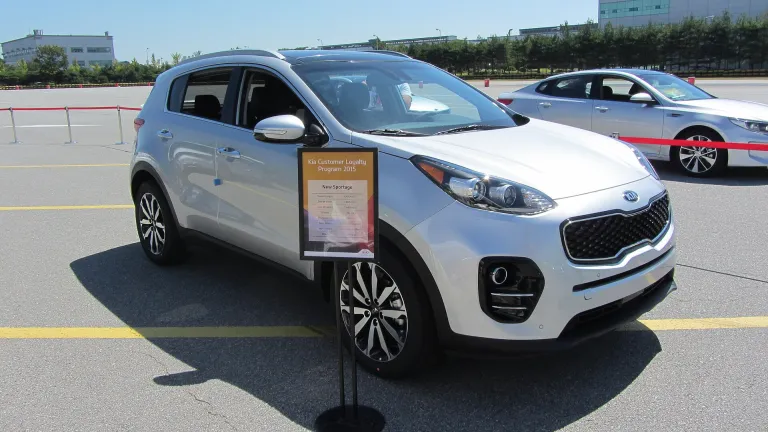
Sportage QL
- Power
- 104 kW141 PS
- 0–100 km/h
- 11.5 s
- Top speed
- 185 km/h
- Kerb mass
- 1,470 kg
Version spec sheet All generations
Photo: Areaseven / Wikimedia Commons, CC BY-SA 4.0
Nissan · 2013–2021
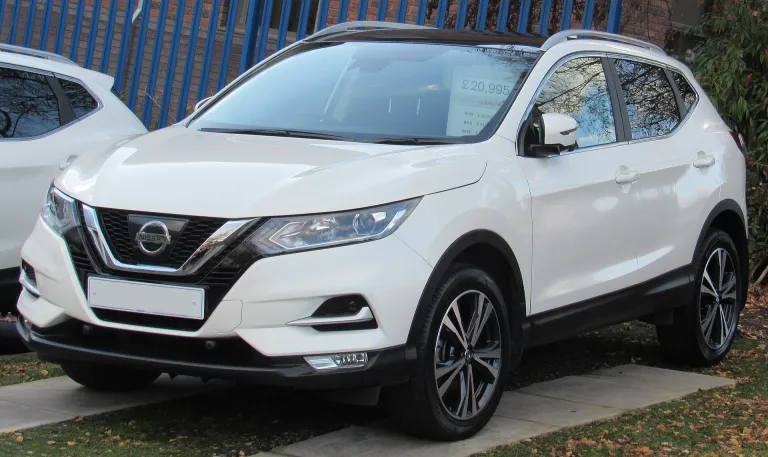
Qashqai J11
- Power
- 85 kW116 PS
- 0–100 km/h
- 10.9 s
- Top speed
- 185 km/h
- Kerb mass
- 1,350 kg
At a glance
Who suits what, worked out from the catalog figures of the versions above.
Categories won: Sportage QL 3 Qashqai J11 2
- Family Sportage QL Boot: 503 l vs 430 l
- City Qashqai J11 Length: 4,377 mm vs 4,480 mm; Width: 1,806 mm vs 1,855 mm
- Long trips Sportage QL Range: 1,265 km vs 982 km (estimated)
- Performance Too close to call Power per tonne: 71 kW/t vs 63 kW/t
- Running costs Sportage QL Fuel per year: €1,210 vs €1,470 (estimated)
- Off-road Qashqai J11 Drive and body: All-wheel drive · SUV vs Front-wheel drive · SUV
In plain words
Nissan Qashqai J11 is quicker: 0–100 km/h in 10.9 s against 11.5 s for Kia Sportage QL. Kia Sportage QL is 103 mm longer than Nissan Qashqai J11 (4,480 mm vs 4,377 mm). Nissan Qashqai J11 is lighter by 120 kg (1,350 kg vs 1,470 kg). Kia Sportage QL has the bigger boot: 503 l against 430 l. At 15,000 km a year, fuel would cost about €1,210 (Kia Sportage QL), €1,470 (Nissan Qashqai J11) (estimated). Nissan Qashqai J11 is the older design (from 2013); Kia Sportage QL arrived in 2015. On the catalog figures, the Kia Sportage QL is the pick for family, long trips and running costs; the Nissan Qashqai J11 is the pick for city and off-road.
Race Stats side by side
Each figure is a 0–100 score from the catalog numbers, the same as on the 1CARS Race cards. PI is the overall performance index (100–999) and its class D–S.
| Stat | Sportage QL | Qashqai J11 |
|---|---|---|
| PI | C · 439 | C · 441 |
| Power | 39 | 36 |
| Grip | 33 | 34 |
| Handling | 55 | 59 |
| Top speed | 33 | 33 |
| Launch | 26 | 28 |
Grip and handling are estimates from drive type, weight, height and body (hover a figure to see where it comes from). 1CARS Race
Who wins a race?
Quarter-mile (402 m) drag from a standing start, dry road, no reaction time - the 1CARS Race physics on the catalog figures of these versions.
- 1 Qashqai J111.2 · petrol · 85 kW (116 PS) 17.58 sat 124 km/h
- 2 Sportage QL1.7 · diesel · 104 kW (141 PS) 17.78 sat 121 km/h · +0.20 s
Size and weight
Side view to scale, all cars from the front bumper.
| Sportage QL | Qashqai J11 | |
|---|---|---|
| Length | 4,480 mm176.4 in † | 4,377 mm172.3 in −103 mm −4.1 in −2.3% |
| Width | 1,855 mm73.0 in † | 1,806 mm71.1 in −49 mm −1.9 in −2.6% |
| Height | 1,635 mm64.4 in † | 1,595 mm62.8 in −40 mm −1.6 in −2.4% |
| Wheelbase | 2,670 mm105.1 in † | 2,646 mm104.2 in −24 mm −0.9 in −0.9% |
| Kerb weight | 1,470 kg3,241 lb | 1,350 kg2,976 lb −120 kg −265 lb −8.2% |
| Boot | 503 l17.8 cu ft | 430 l15.2 cu ft −73 l −2.6 cu ft −14.5% |
| Fuel tank | 62 l16.4 gal US | 55 l14.5 gal US −7 l −1.8 gal US −11.3% |
| Fits a standard garage? | Tight | Yes |
Difference vs Sportage QL (±). Garage check: a standard single garage takes a car up to about 5.0 m (16 ft 5 in) long and 1.9 m (6 ft 3 in) wide (width as listed in the catalog; some makers include the mirrors). Leave about 0.6 m (2 ft) to open the doors. † from another version of this generation.
Full specifications
| Kia Sportage QL | Nissan Qashqai J11 | |
|---|---|---|
| General | ||
| Version | 1.7 · diesel · 104 kW (141 PS) | 1.2 · petrol · 85 kW (116 PS) |
| Production years | 2015–2021 | 2013–2021 |
| Body | SUV | SUV |
| Class | SUV / crossover | SUV / crossover |
| Country | South Korea | Japan |
| Performance | ||
| Power Why it matters: More power means stronger acceleration and easier overtaking, especially with a full load. | 104 kW (141 PS) 139 hp Better | 85 kW (116 PS) 114 hp |
| Power, all versions | 85–179 kW (116–243 PS) 114–240 hp | 81–120 kW (110–163 PS) 109–161 hp |
| 0–100 km/h Why it matters: A shorter 0–100 km/h time means quicker getaways and safer merging onto fast roads. | 11.5 s | 10.9 s Better |
| Top speed Why it matters: Top speed hints at how relaxed the car is at motorway speeds, even if you never reach it. | 185 km/h 115 mph | 185 km/h 115 mph |
| Power per tonne | 71 kW/t 86 hp/ton calculated Better | 63 kW/t 77 hp/ton calculated |
| Engine and transmission | ||
| Fuel | Diesel | Petrol |
| Engine | 1,700 cc 1.7 l | 1,200 cc 1.2 l |
| Gearbox | 7-speed dual-clutch | No data |
| Drive | Front-wheel drive | All-wheel drive |
| Dimensions and weight | ||
| Length | 4,480 mm 176.4 in † | 4,377 mm 172.3 in |
| Width | 1,855 mm 73.0 in † | 1,806 mm 71.1 in |
| Height | 1,635 mm 64.4 in † | 1,595 mm 62.8 in |
| Wheelbase | 2,670 mm 105.1 in † | 2,646 mm 104.2 in |
| Kerb weight Why it matters: A lighter car is usually more agile and uses less energy. | 1,470 kg 3,241 lb | 1,350 kg 2,976 lb Better |
| Boot Why it matters: A bigger boot fits more luggage, shopping or a pram. | 503 l 17.8 cu ft Better | 430 l 15.2 cu ft |
| Fuel tank Why it matters: A larger tank means more distance between fuel stops. | 62 l 16.4 gal US Better | 55 l 14.5 gal US |
| Economy and running costs | ||
| Fuel consumption Why it matters: Lower consumption cuts running costs and CO₂ emissions on every trip. | 4.9 l/100 km 48.0 mpg US Better | 5.6 l/100 km 42.0 mpg US |
| CO₂ | 129 g/km | 129 g/km |
| Fuel cost per year | €1,210/year estimated Better | €1,470/year estimated |
| Range on a full tank | 1,265 km 786 mi estimated Better | 982 km 610 mi estimated |
| Safety | ||
| Euro NCAP | ★★★★★ (2015) | ★★★★★ (2014) |
These cars do not differ in the data we have.
Equal rows hidden (4): Body, Class, Top speed, CO₂.
Better marks the stronger figure - only for measurable specs (power, torque, 0–100 km/h, consumption, boot, weight).
Estimated at 15,000 km a year with fuel at €1.65/l diesel, €1.75/l petrol. † from another version of this generation.