
Ford Escape vs Suzuki Grand Vitara: specs side by side
Quick comparison from catalog data - no editorial review of this pair yet.

Ford · 2013
Escape
- Power
- 93 kW126 PS
- 0–100 km/h
- -
- Top speed
- -
- Kerb mass
- -

Suzuki · 1998–2005
Grand Vitara I (FT/GT)
- Power
- 116 kW158 PS
- 0–100 km/h
- 12.4 s
- Top speed
- 170 km/h
- Kerb mass
- 1,245 kg
In plain words
Suzuki Grand Vitara has more power: 116 kW (158 PS) against 93 kW (126 PS) for Ford Escape. Suzuki Grand Vitara is the older design (from 1998); Ford Escape arrived in 2001. Suzuki Grand Vitara is still in production; Ford Escape is not. Our catalog has no 0–100 km/h for the Ford Escape yet, so some checks above leave it out.
Full specifications
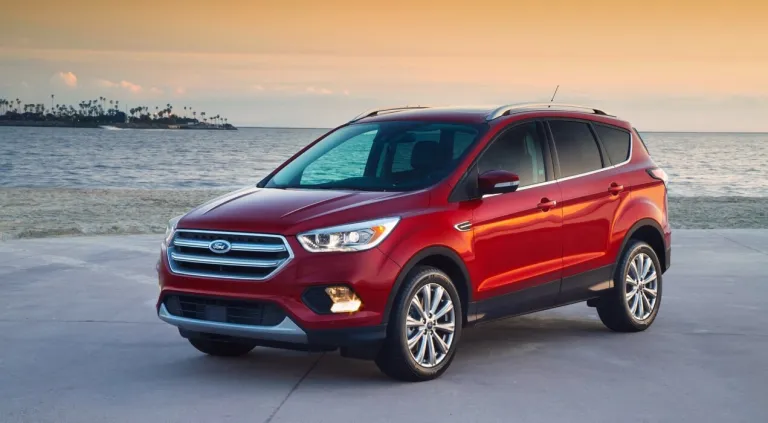
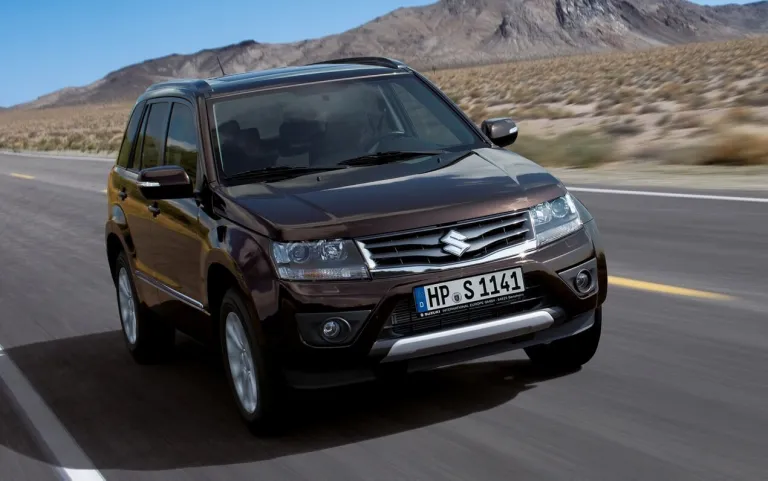
| Ford Escape | Suzuki Grand Vitara | |
|---|---|---|
| General | ||
| Version | 2.0 · petrol · 93 kW (126 PS) | Grand Vitara I (FT/GT) · 116 kW (158 PS) |
| Production years | 2013 | 1998–2005 |
| Body | SUV | SUV, Convertible |
| Class | SUV / crossover | SUV / crossover |
| Country | United States | Japan |
| Performance | ||
| Power Why it matters: More power means stronger acceleration and easier overtaking, especially with a full load. | 93 kW (126 PS) 125 hp | 116 kW (158 PS) 156 hp Better |
| Power, all versions | 93–186 kW (126–253 PS) 125–249 hp | 64–135 kW (87–184 PS) 86–181 hp |
| 0–100 km/h Why it matters: A shorter 0–100 km/h time means quicker getaways and safer merging onto fast roads. | No data | 12.4 s |
| Top speed Why it matters: Top speed hints at how relaxed the car is at motorway speeds, even if you never reach it. | No data | 170 km/h 106 mph |
| Power per tonne | No data | 93 kW/t 113 hp/ton calculated |
| Engine and transmission | ||
| Fuel | Petrol | No data |
| Engine | 2,000 cc · 4 cyl 2.0 l | 6 cyl |
| Gearbox | No data | automatic |
| Drive | No data | Four-wheel drive (4×4) |
| Dimensions and weight | ||
| Length | No data | 4,700 mm 185.0 in |
| Kerb weight Why it matters: A lighter car is usually more agile and uses less energy. | No data | 1,245 kg 2,745 lb |
| Economy and running costs | ||
| Fuel consumption Why it matters: Lower consumption cuts running costs and CO₂ emissions on every trip. | No data | 10.9 l/100 km 21.6 mpg US |
These cars do not differ in the data we have.
Equal rows hidden (1): Class.
Better marks the stronger figure - only for measurable specs (power, torque, 0–100 km/h, consumption, boot, weight).