
Toyota Corolla E210 vs Toyota C-HR II: specs side by side
Quick comparison from catalog data - no editorial review of this pair yet.

Toyota · 2018–present
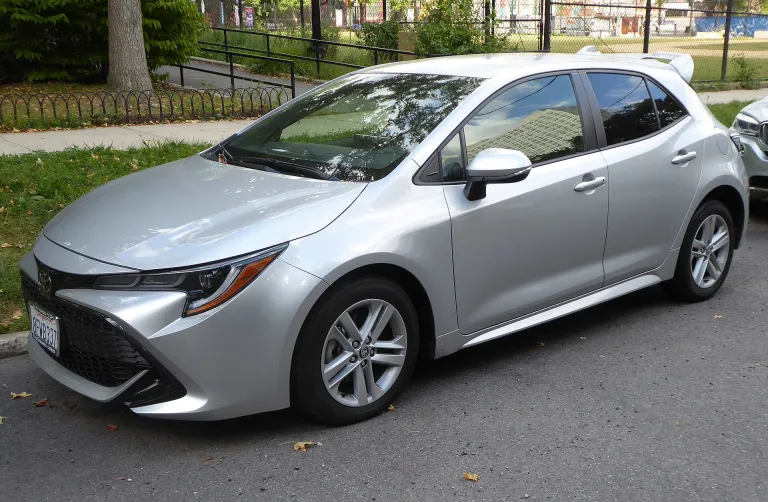
Corolla E210
- Power
- 85 kW116 PS
- 0–100 km/h
- 9.3 s
- Top speed
- 200 km/h
- Kerb mass
- 1,240 kg

Toyota · 2023–present
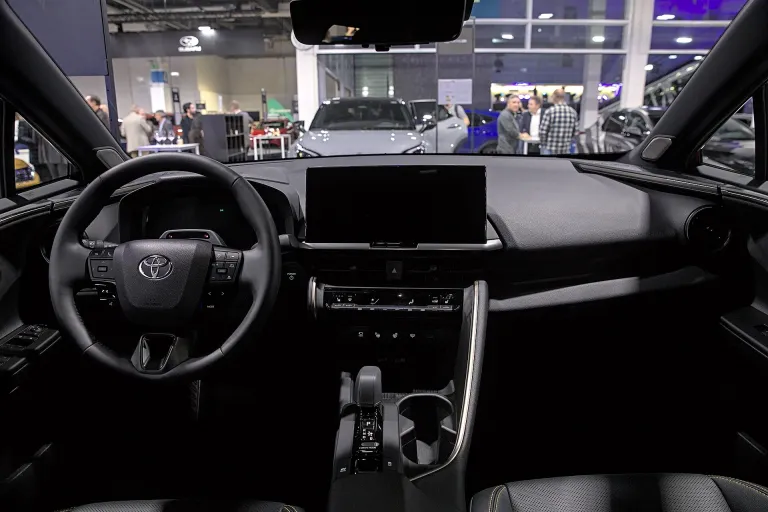
C-HR II
- Power
- 164 kW223 PS
- 0–100 km/h
- 7.4 s
- Top speed
- 180 km/h
- Kerb mass
- -
At a glance
Who suits what, worked out from the catalog figures of the versions above.
Categories won: Corolla E210 0 C-HR II 3
- Family C-HR II Boot: 443 l vs 361 l
- Performance C-HR II 0–100 km/h: 7.4 s vs 9.3 s
- Off-road C-HR II Drive and body: Front-wheel drive · Crossover vs Front-wheel drive · Hatchback
In plain words
Toyota C-HR II is quicker: 0–100 km/h in 7.4 s against 9.3 s for Toyota Corolla E210. Toyota C-HR II has the bigger boot: 443 l against 361 l. Toyota Corolla E210 is the older design (from 2018); Toyota C-HR II arrived in 2023. On the catalog figures, the Toyota C-HR II is the pick for family, performance and off-road. Our catalog has no kerb mass for the Toyota C-HR II yet, so some checks above leave it out.
Race Stats side by side
Each figure is a 0–100 score from the catalog numbers, the same as on the 1CARS Race cards. PI is the overall performance index (100–999) and its class D–S.
| Stat | Corolla E210 | C-HR II |
|---|---|---|
| PI | C · 495 | B · 511 |
| Power | 38 | 43 |
| Grip | 40 | 40 |
| Handling | 72 | 67 |
| Top speed | 38 | 31 |
| Launch | 35 | 46 |
Grip and handling are estimates from drive type, weight, height and body (hover a figure to see where it comes from). 1CARS Race
Who wins a race?
Quarter-mile (402 m) drag from a standing start, dry road, no reaction time - the 1CARS Race physics on the catalog figures of these versions.
- 1 C-HR II2.0 Plug-in Hybrid · 164 kW (223 PS) 15.55 sat 142 km/h
- 2 Corolla E2101.2 Turbo · petrol · 85 kW (116 PS) 16.73 sat 132 km/h · +1.18 s
Size and weight
| Corolla E210 | C-HR II | |
|---|---|---|
| Boot | 361 l12.7 cu ft | 443 l15.6 cu ft † +82 l +2.9 cu ft +22.7% |
| Fits a standard garage? | Yes | No data |
Difference vs Corolla E210 (±). Garage check: a standard single garage takes a car up to about 5.0 m (16 ft 5 in) long and 1.9 m (6 ft 3 in) wide (width as listed in the catalog; some makers include the mirrors). Leave about 0.6 m (2 ft) to open the doors. † from another version of this generation.
Full specifications
| Toyota Corolla E210 | Toyota C-HR II | |
|---|---|---|
| General | ||
| Version | 1.2 Turbo · petrol · 85 kW (116 PS) | 2.0 Plug-in Hybrid · 164 kW (223 PS) |
| Production years | 2018–present | 2023–present |
| Body | Hatchback | Crossover |
| Class | No data | SUV / crossover |
| Country | Japan | Japan |
| Performance | ||
| Power Why it matters: More power means stronger acceleration and easier overtaking, especially with a full load. | 85 kW (116 PS) 114 hp | 164 kW (223 PS) 220 hp Better |
| Power, all versions | 85–144 kW (116–196 PS) 114–193 hp | 103–164 kW (140–223 PS) 138–220 hp |
| 0–100 km/h Why it matters: A shorter 0–100 km/h time means quicker getaways and safer merging onto fast roads. | 9.3 s | 7.4 s Better |
| Top speed Why it matters: Top speed hints at how relaxed the car is at motorway speeds, even if you never reach it. | 200 km/h 124 mph Better | 180 km/h 112 mph |
| Power per tonne | 69 kW/t 83 hp/ton calculated | No data |
| Engine and transmission | ||
| Fuel | Petrol | Plug-in hybrid |
| Engine | No data | 1,986 cc · 4 cyl 2.0 l |
| Engine code | 8NR-FTS | M20A-FXS |
| Gearbox | No data | CVT |
| Drive | Front-wheel drive | Front-wheel drive |
| Dimensions and weight | ||
| Length | 4,370 mm 172.0 in | No data |
| Width | 1,790 mm 70.5 in | No data |
| Height | 1,435 mm 56.5 in | No data |
| Wheelbase | 2,640 mm 103.9 in | No data |
| Kerb weight Why it matters: A lighter car is usually more agile and uses less energy. | 1,240 kg 2,734 lb | No data |
| Boot Why it matters: A bigger boot fits more luggage, shopping or a pram. | 361 l 12.7 cu ft | 443 l 15.6 cu ft † Better |
| Fuel tank Why it matters: A larger tank means more distance between fuel stops. | 50 l 13.2 gal US | No data |
| Economy and running costs | ||
| Fuel consumption Why it matters: Lower consumption cuts running costs and CO₂ emissions on every trip. | 6.2 l/100 km 37.9 mpg US | No data |
| CO₂ | 141 g/km | No data |
| Fuel cost per year | €1,630/year estimated | No data |
| Range on a full tank | 806 km 501 mi estimated | No data |
| Electric | ||
| Battery Why it matters: A bigger battery usually gives more range, but takes longer to charge fully. | No data | 14 kWh |
| Electric range Why it matters: A longer range means fewer charging stops on long journeys. | No data | 66 km 41 mi |
| Safety | ||
| Euro NCAP | ★★★★★ (2019) | No data |
These cars do not differ in the data we have.
Equal rows hidden (2): Country, Drive.
Better marks the stronger figure - only for measurable specs (power, torque, 0–100 km/h, consumption, boot, weight).
Estimated at 15,000 km a year with fuel at €1.75/l petrol. † from another version of this generation.